Custom Obsidian Setup: Hometab Images, Search, Radar, and Workspaces
This guide explains how to configure your Obsidian setup with embedded images, searchable hometabs, radar charts, and a default workspace. It requires some core and community plugins, and code snippets.
Table of Contents
- Themes and Plugins
- Embedding Images in Hometab
- Adding a Search Menu to Hometab
- Implementing a Radar Chart
- Setting a Default Workspace on Startup
Themes and Plugins
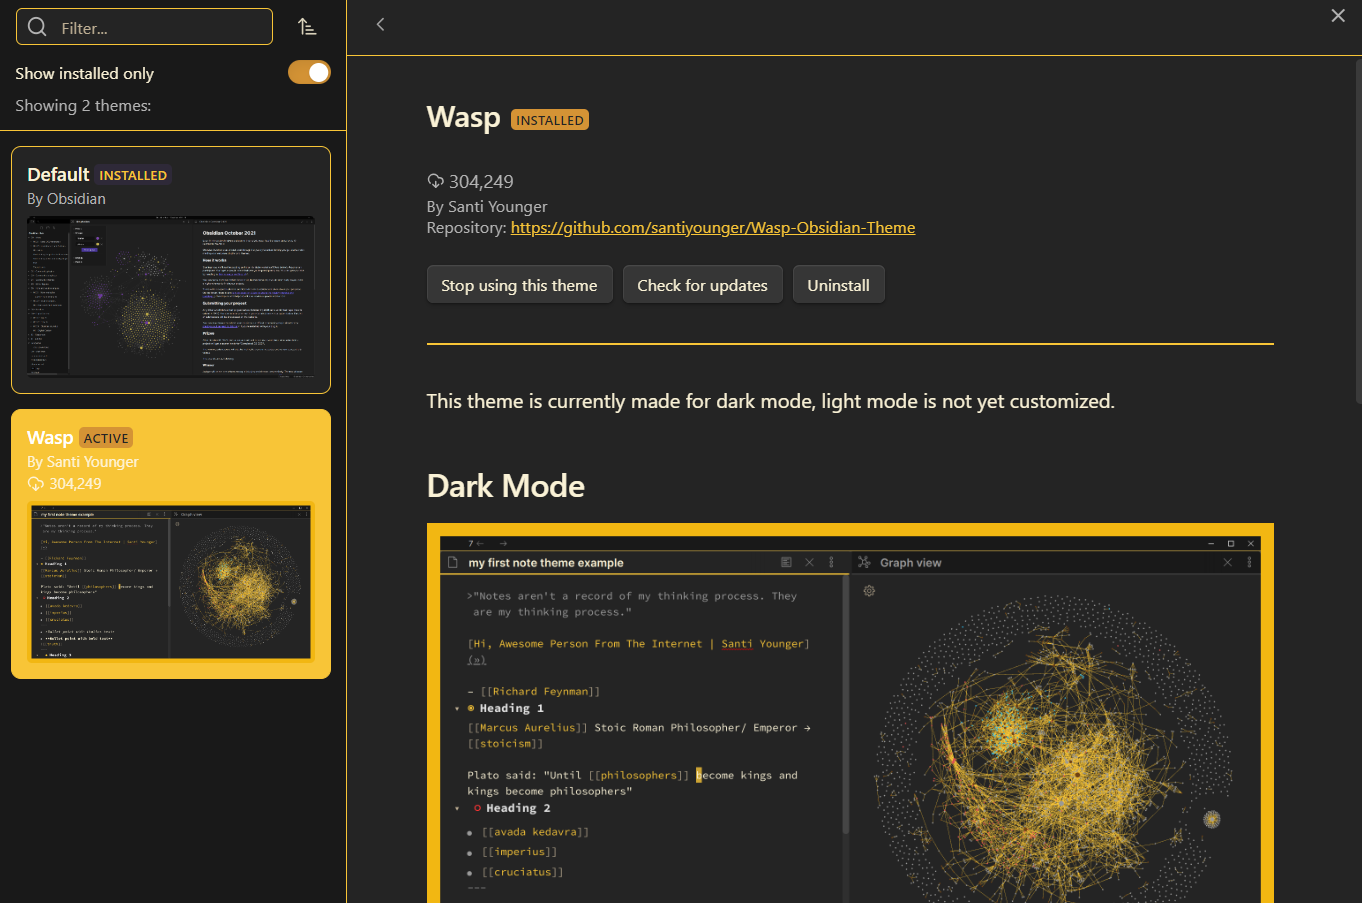
Theme in use
- Wasp Theme
Core Plugins
- workspaces
Community Plugins
- Required:
- Banner (for custom image banners)
- Charts View
- Dataview
- Hometab
- Homepage
-
Omnisearch
Embedding Images in Hometab
Adding images to Hometab is done with a CSS snippet.
Steps:
- Install and enable the Hometab plugin.
- Navigate to your vault’s
.obsidian/snippetsfolder. - Create a CSS snippet that includes a
.hometabselector.(or copy the basic snippet from below) - Convert your image to Base64 to avoid path conflicts.
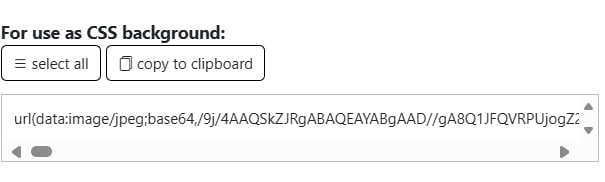
- Include your Base64 file inside the snippet. This is one resource for conversion Base64 convertor site
/*Banner for HomeTab plugin */
.home-tab::before {
  content: "";
  display: block;
  width: 100%;
  height: 320px;
  background-image:
    linear-gradient(to bottom, rgba(0, 0, 0, 0) 70%, var(--background-primary) 100%),
    url(data:) /*insert base64 image here*/
    background-size: cover;
  background-position: center;
  border-radius: var(--input-radius);
  box-shadow: 0 4px 12px rgba(0, 0, 0, 0.2);
  margin-bottom: 0; /* no extra gap */
  z-index: 0;
}

/* Ensure the container fills the view */
.home-tab {
  position: relative;
  height: 100%;
  min-height: 100vh;
  overflow: hidden;
}
Activate the snippet in Obsidian appearance settings and configure text/display options in the Hometab plugin settings.

Adding a Search Menu to Hometab
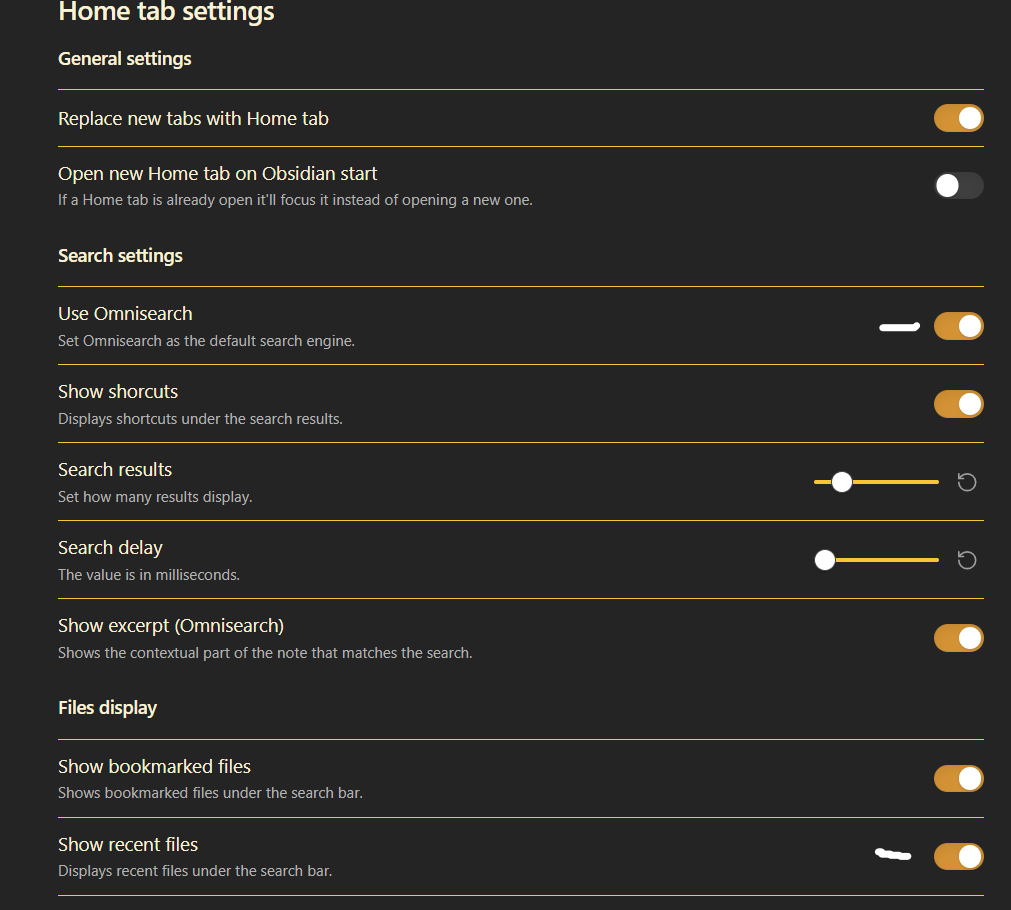
Search functionality can be added using Omnisearch.
Steps:
Install and enable Omnisearch.

Open Hometab plugin settings.

Enable Use Omnisearch.

Optionally, enable Recent Files.
Implementing a Radar Chart
Radar charts can be implemented to help visualize tag usage or focus areas across notes.
Steps:
Install and enable Dataview and Charts View.

In Dataview settings, enable all options.

Create a note and paste your radar chart snippet:
Dataview Radar Code Snippet
Copy this into your note inside a dataviewjs code block e.g(dataviewjs ...):
// === Fetch Tags & Counts Automatically ===
const tagMap = {};
dv.pages().forEach(p => {
  if (p.file.tags) {
    p.file.tags.forEach(tag => {
      tagMap[tag] = (tagMap[tag] || 0) + 1;
    });
  }
});

const tagData = Object.entries(tagMap)
  .map(([tag, count]) => ({
    label: tag.replace(/^#/, ""), // Remove leading "#"
    value: count
  }))
  .sort((a, b) => b.value - a.value); // Most frequent first

// Build YAML data lines
const chartYaml = tagData
  .map(t => `  - label: "${t.label}"\n    value: ${t.value}`)
  .join("\n");

dv.paragraph(`
\`\`\`chartsview
type: Radar
data:
${chartYaml}
options:
  xField: "label"
  yField: "value"
  seriesField: null
  enableSearchInteraction: true  # <-- enables clicking
  areaStyle:
    fill: "rgba(0,200,83,0.2)"
  lineStyle:
    stroke: "rgba(0,200,83,1)"
    lineWidth: 2
  point:
    size: 4
    style:
      fill: "rgba(0,200,83,1)"
\`\`\`
`);
Customize according to your tracking needs.
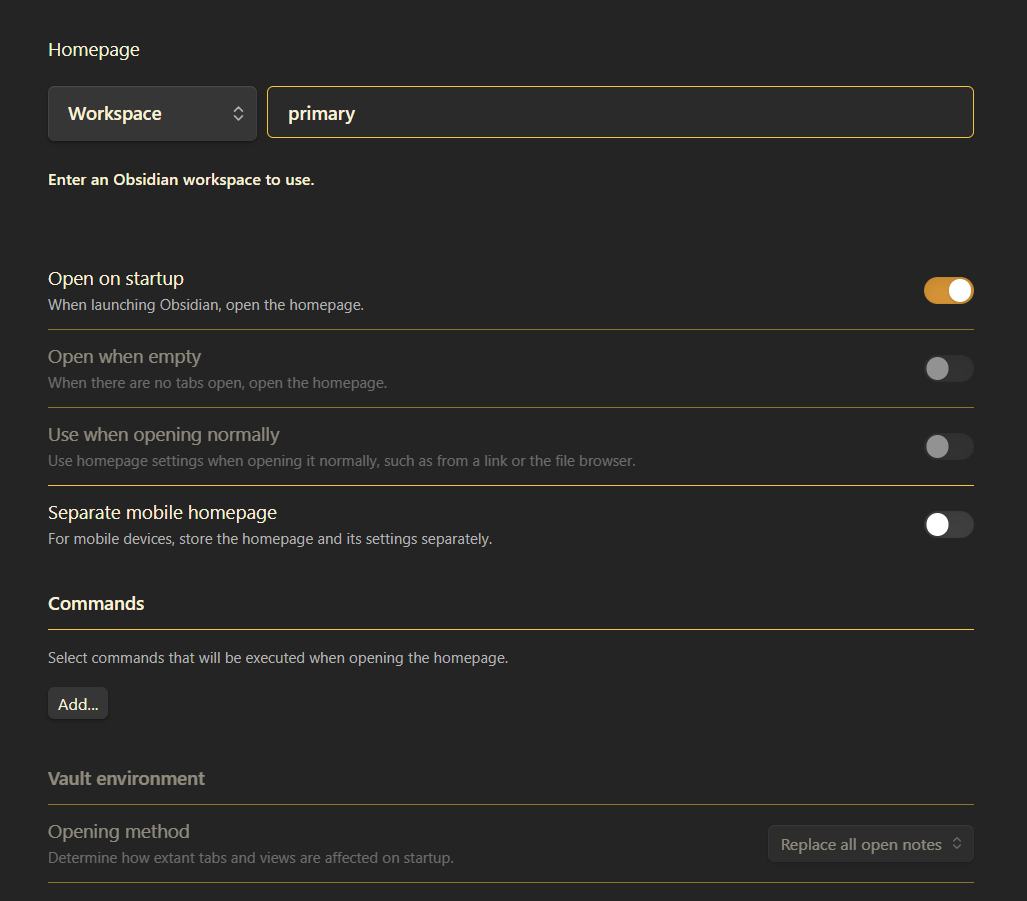
Setting a Default Workspace on Startup
You can set a workspace to open automatically with your preferred layout.
Steps:
Enable Workspaces from core plugins.

Install and enable Homepage.

Customize your layout and pin notes if necessary.

Go to workspace settings:

    Save your workspace layout.

    Enable Open on Default.